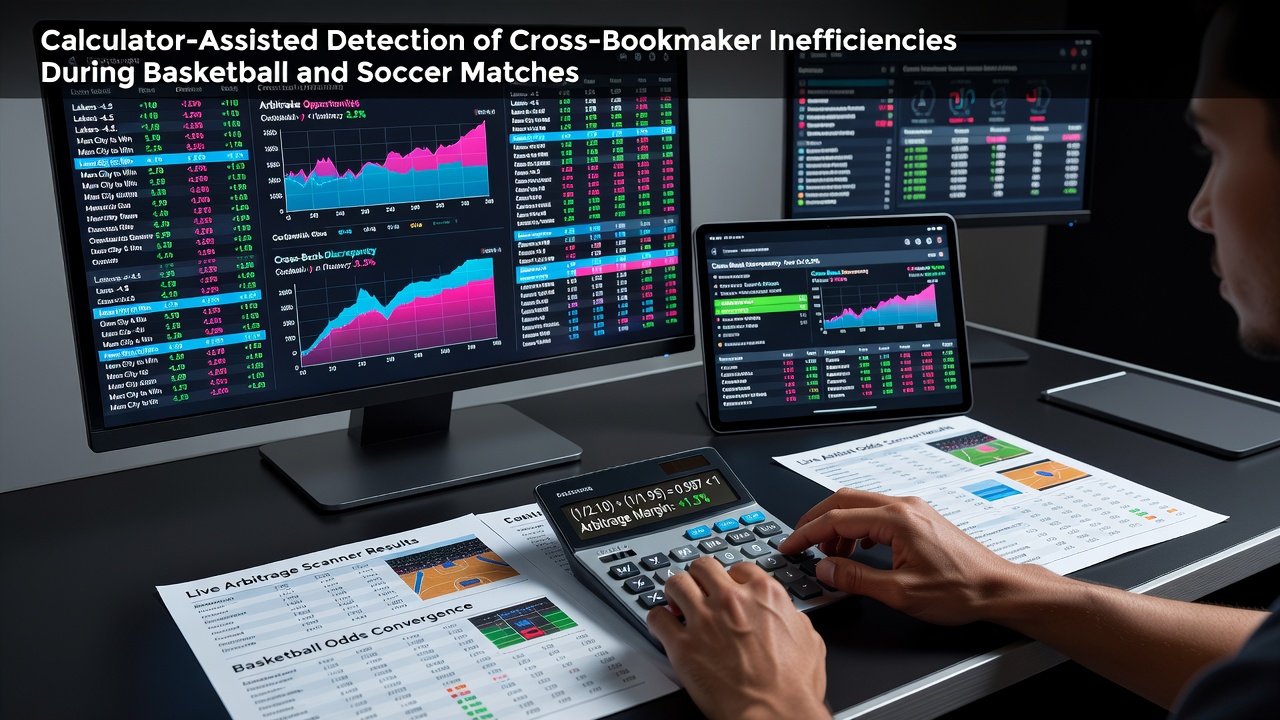
Utilizing Calculators to Detect Inefficiencies Between Different Bookmakers in Basketball and Soccer Events
Calculators designed for cross-bookmaker analysis process live odds feeds from various platforms to flag price variations that emerge during basketball and soccer contests. These tools pull data streams simultaneously and apply mathematical formulas that convert quoted prices into implied probabilities while accounting for margins. When discrepancies exceed a set threshold the system highlights potential opportunities for users who monitor multiple accounts at once. Observers note that such detection relies on rapid updates since odds shift frequently as events unfold on the court or pitch.
Core Mechanics Behind Calculator Functions
Software routines inside these calculators compare decimal or fractional odds across selected operators by converting each quote into a common probability metric. The process subtracts the sum of implied probabilities from one hundred percent to reveal any overround differences that appear between platforms. When one bookmaker offers a higher implied return on the same outcome than another the tool records the gap and calculates the stake distribution needed to lock in a fixed return regardless of result. Data indicates that accuracy improves when users supply precise commission rates and currency conversions for each operator involved.
Application During Live Basketball Matches
In basketball games with frequent scoring runs the pace of odds movement accelerates especially in the final minutes of quarters. Calculators track point spreads and totals across several sites by refreshing feeds every few seconds so users can respond before adjustments occur. One study revealed that half-time line movements often create windows where the same team receives different prices from competing operators due to differing risk models. Those who integrate calculator alerts with live video feeds report the ability to act within narrow time frames before markets realign.
Application During Live Soccer Matches
Soccer presents different dynamics because goals arrive less often yet carry larger impact on match outcomes. Calculators monitor both match winner and over-under goal lines while factoring in stoppage time and substitution patterns that influence late price shifts. Figures from European betting data show that red card events frequently produce cross-platform spreads that calculators isolate within seconds of official confirmation. Users combine these signals with possession statistics and expected goal models to confirm whether a flagged inefficiency stems from genuine market lag or from temporary liquidity differences.
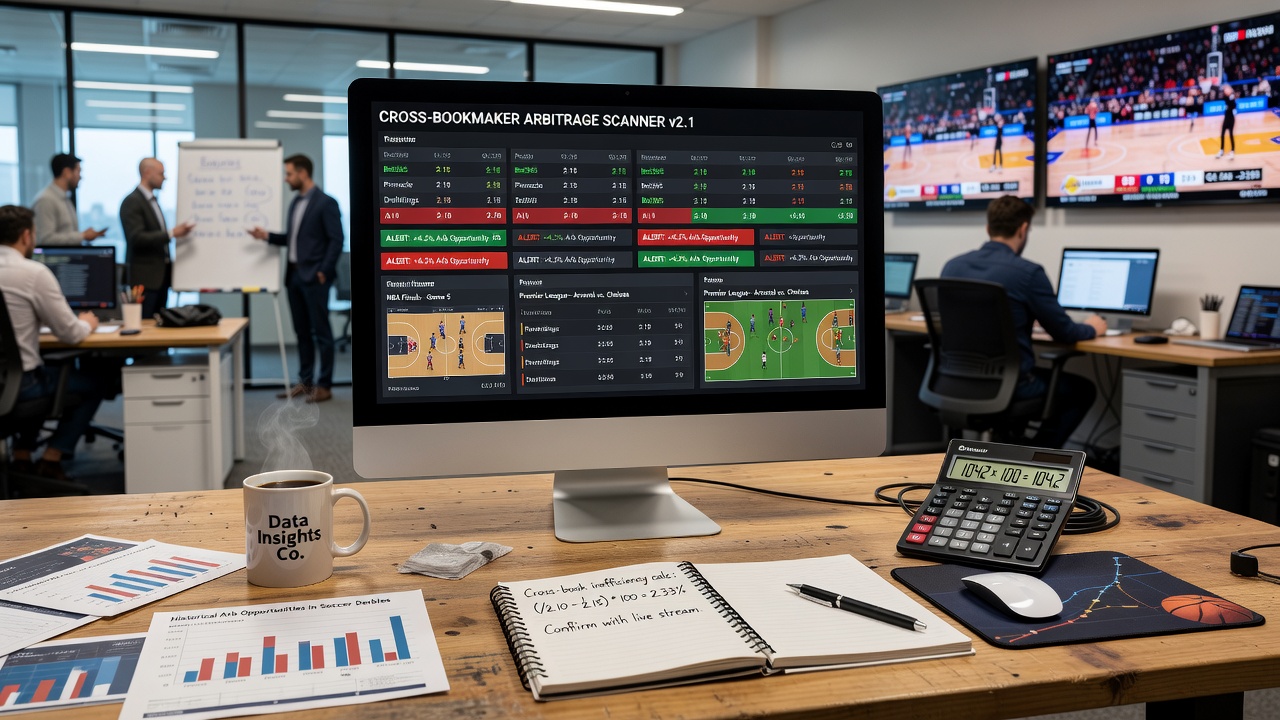
Integration With Broader Data Sources in August 2026
By August 2026 several platforms incorporated real-time weather feeds and player injury updates directly into calculator dashboards for soccer and basketball events. This addition allowed the software to adjust probability baselines before comparing bookmaker quotes which reduced false positives triggered by external factors. Research from the Australian Gambling Research Centre indicates that markets incorporating such contextual layers exhibited narrower average spreads between operators during major international tournaments. Analysts at the Nevada Gaming Control Board have documented similar patterns in domestic leagues where calculator users adjusted stake allocations more precisely after incorporating venue-specific data.
Stake Allocation Formulas and Risk Controls
Calculators employ the Kelly criterion variant or simpler proportional methods to suggest stake sizes that maintain positive expected value across the matched positions. The formulas divide total capital according to the inverse of each price while ensuring the combined payout remains identical irrespective of final score. Users apply additional filters that exclude operators with delayed settlement histories or those operating under temporary liquidity restrictions. Evidence suggests these safeguards help maintain consistent execution rates even when multiple bookmakers adjust lines simultaneously during high-profile matches.
Limitations Observed in Field Deployments
Network latency and account verification delays continue to constrain the practical window for acting on detected inefficiencies. Some operators impose maximum stake limits that prevent full execution of recommended allocations when larger capital amounts enter the market. Observers note that regulatory requirements in certain jurisdictions mandate cooling-off periods between deposits which can interrupt rapid multi-bookmaker positioning. Despite these constraints the core detection logic remains unchanged and continues to operate on available data feeds.
Conclusion
Calculator-assisted comparison of bookmaker prices supplies a structured method for identifying variations that arise during basketball and soccer events. The approach depends on continuous data ingestion combined with standardized probability conversion and stake distribution routines. As additional contextual feeds enter these systems in periods such as August 2026 the precision of flagged opportunities continues to evolve. Users who maintain diversified operator access and apply defined risk parameters obtain repeatable processes for navigating cross-platform price differences without reliance on subjective judgment.